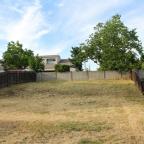
Could allotments help solve the housing crisis by providing 600,000 new homes?
England’s allotments could provide space for over 600,000 new homes, according to the latest research by the estate agent comparison site, GetAgent.co.uk.
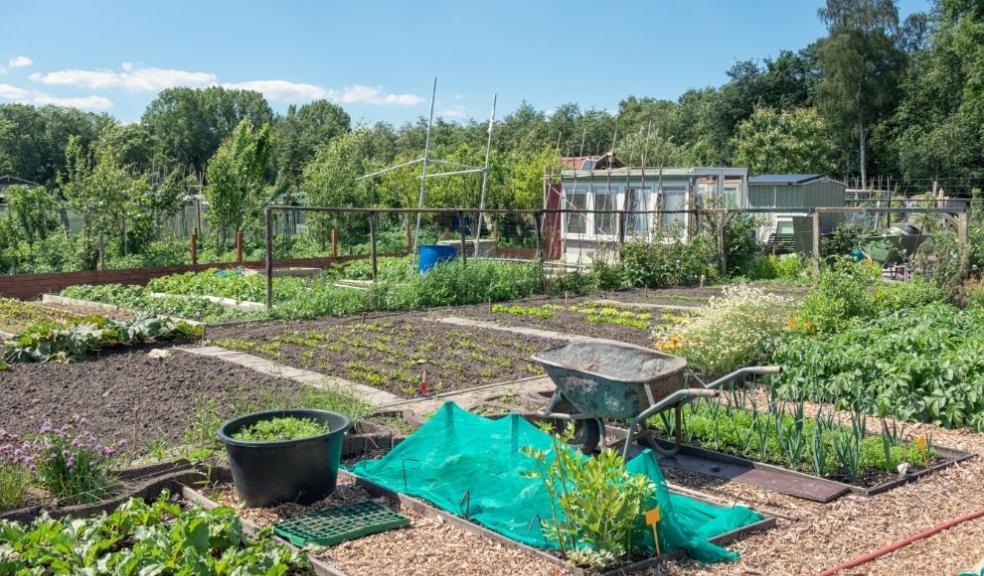
GetAgent’s research found that there are an estimated 4,554 allotments across the nation containing roughly 177,606 plots, each at an average size of 250 square metres. That’s a potential 44,401,500 square metres of allotment space, enough to build 604,513 new homes based on the average property size of 73.45 sqm.
With the average new-build house price in England currently £348,298, it also equates to £210.5bn worth of homes.
London is home to the greatest level of allotment new-build potential, with over 7m sqm of allotment space able to facilitate 95,575 new homes to the tune of £50.3bn in market value.
Tyne and Wear comes in second, with its 291 allotments spread across an estimated 2.8m sqm able to facilitate 38,628 new homes.
The available allotment space across the West Midlands (35,442), Greater Manchester (32,788), County Durham (27,478), West Yorkshire (22,566) and Hertfordshire (22,301) could also potentially accommodate over 20,000 new homes in each area.
Outside of London, Hertfordshire (£10.4bn), the West Midlands (£9.3m) and Tyne and Wear (9.3m) also rank top where the highest potential value of these new homes is concerned, with Surrey also home to a potential value of £8.5bn in allotment new-builds.
In contrast, just one allotment space is recorded in the City of London. Despite this, the 9,750 sqm could still see 133 homes built to the tune of £109.8m.
Founder and CEO of GetAgent.co.uk, Colby Short, commented:
“Allotments can play a very important role within the community, particularly in our major cities, providing the outdoor space that many look to in order to relax, unwind and socialise. So in this respect, they are probably more valuable than any bricks and mortar market value.
However, we desperately need more homes, an issue that the government has been woefully poor at addressing. While we don’t suggest that allotments are the answer, we wanted to draw attention to the fact that more must be done.
Rather than sacrifice the nation’s allotments, there is a great deal of brownfield and wrongly classified green belt land that could go some way in helping deliver more homes. But until the government decides to pull its finger out, it will continue to sit unused and of no use to anybody.”
|
Table shows the number of allotments in each area, the total space based on an average of 39 plots per site at 250 sq m each, how many homes this could facilitate based on the average UK property size of 73.45 sqm and what this number of homes could be worth based on the current new build house price |
||||||
|
County |
Total number of allotment sites |
Est number of plots at an average of 39 per site |
Est area of allotments at 250 sq m per plot on average |
Potential number of average size homes at UK average of 73.45 sq m |
Average new-build house price |
Potential value of New build homes |
|
Greater London |
720 |
28,080 |
7,020,000 |
95,575 |
£525,927 |
£50,265,625,718 |
|
Hertfordshire |
168 |
6,552 |
1,638,000 |
22,301 |
£464,798 |
£10,365,402,881 |
|
West Midlands |
267 |
10,413 |
2,603,250 |
35,442 |
£262,955 |
£9,319,794,289 |
|
Tyne and Wear |
291 |
11,349 |
2,837,250 |
38,628 |
£240,996 |
£9,309,270,026 |
|
Surrey |
120 |
4,680 |
1,170,000 |
15,929 |
£534,800 |
£8,518,942,510 |
|
Greater Manchester |
247 |
9,633 |
2,408,250 |
32,788 |
£242,226 |
£7,942,004,134 |
|
Essex |
137 |
5,343 |
1,335,750 |
18,186 |
£415,782 |
£7,561,339,702 |
|
Devon |
127 |
4,953 |
1,238,250 |
16,858 |
£373,471 |
£6,296,129,101 |
|
Kent |
122 |
4,758 |
1,189,500 |
16,195 |
£386,814 |
£6,264,325,220 |
|
West Yorkshire |
170 |
6,630 |
1,657,500 |
22,566 |
£237,168 |
£5,352,017,026 |
|
City of Bristol |
112 |
4,368 |
1,092,000 |
14,867 |
£318,908 |
£4,741,286,464 |
|
County Durham |
207 |
8,073 |
2,018,250 |
27,478 |
£169,866 |
£4,667,560,244 |
|
Hampshire |
90 |
3,510 |
877,500 |
11,947 |
£388,365 |
£4,639,762,863 |
|
Northamptonshire |
95 |
3,705 |
926,250 |
12,611 |
£339,161 |
£4,277,034,580 |
|
Worcestershire |
92 |
3,588 |
897,000 |
12,212 |
£348,596 |
£4,257,193,921 |
|
Staffordshire |
108 |
4,212 |
1,053,000 |
14,336 |
£284,568 |
£4,079,640,405 |
|
Leicestershire |
83 |
3,237 |
809,250 |
11,018 |
£344,705 |
£3,797,853,803 |
|
West Sussex |
66 |
2,574 |
643,500 |
8,761 |
£430,115 |
£3,768,261,063 |
|
North Yorkshire |
95 |
3,705 |
926,250 |
12,611 |
£293,221 |
£3,697,692,947 |
|
Lancashire |
105 |
4,095 |
1,023,750 |
13,938 |
£252,492 |
£3,519,249,977 |
|
Cumbria |
116 |
4,524 |
1,131,000 |
15,398 |
£227,266 |
£3,499,500,594 |
|
Derbyshire |
96 |
3,744 |
936,000 |
12,743 |
£272,334 |
£3,470,455,172 |
|
Somerset |
70 |
2,730 |
682,500 |
9,292 |
£334,463 |
£3,107,838,842 |
|
South Yorkshire |
111 |
4,329 |
1,082,250 |
14,735 |
£202,534 |
£2,984,239,403 |
|
Berkshire |
53 |
2,067 |
516,750 |
7,035 |
£408,886 |
£2,876,677,124 |
|
East Sussex |
57 |
2,223 |
555,750 |
7,566 |
£379,487 |
£2,871,337,016 |
|
Warwickshire |
53 |
2,067 |
516,750 |
7,035 |
£402,492 |
£2,831,691,063 |
|
Norfolk |
61 |
2,379 |
594,750 |
8,097 |
£320,887 |
£2,598,334,329 |
|
Merseyside |
87 |
3,393 |
848,250 |
11,549 |
£222,220 |
£2,566,343,327 |
|
Cheshire |
62 |
2,418 |
604,500 |
8,230 |
£300,993 |
£2,477,197,604 |
|
Gloucestershire |
42 |
1,638 |
409,500 |
5,575 |
£396,220 |
£2,209,013,065 |
|
Nottinghamshire |
70 |
2,730 |
682,500 |
9,292 |
£237,177 |
£2,203,861,340 |
|
Buckinghamshire |
32 |
1,248 |
312,000 |
4,248 |
£459,667 |
£1,952,567,497 |
|
Cambridgeshire |
30 |
1,170 |
292,500 |
3,982 |
£403,510 |
£1,606,897,780 |
|
Wiltshire |
29 |
1,131 |
282,750 |
3,850 |
£358,640 |
£1,380,605,215 |
|
Lincolnshire |
40 |
1,560 |
390,000 |
5,310 |
£234,421 |
£1,244,712,313 |
|
Bedfordshire |
24 |
936 |
234,000 |
3,186 |
£381,826 |
£1,216,437,374 |
|
Dorset |
30 |
1,170 |
292,500 |
3,982 |
£301,871 |
£1,202,142,595 |
|
Oxfordshire |
20 |
780 |
195,000 |
2,655 |
£443,585 |
£1,177,659,987 |
|
Suffolk |
16 |
624 |
156,000 |
2,124 |
£351,160 |
£745,825,541 |
|
Shropshire |
13 |
507 |
126,750 |
1,726 |
£284,550 |
£491,038,208 |
|
Cornwall |
10 |
390 |
97,500 |
1,327 |
£277,343 |
£368,154,111 |
|
Isle of Wight |
5 |
195 |
48,750 |
664 |
£279,408 |
£185,447,480 |
|
East Riding of Yorkshire |
4 |
156 |
39,000 |
531 |
£269,438 |
£143,064,416 |
|
City of London |
1 |
39 |
9,750 |
133 |
£827,241 |
£109,810,778 |
|
England |
4554 |
177,606 |
44,401,500 |
604,513 |
£348,298 |
£210,550,917,306 |
|
|
|
|
|
|
|
|