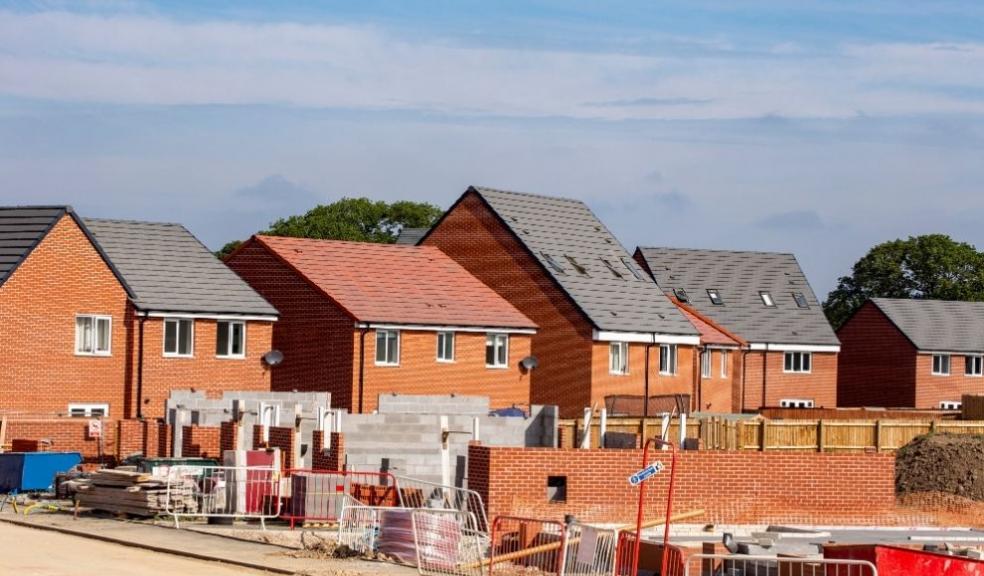
New build price premiums hit 106% in parts of Britain
The latest research from Warwick Estates has revealed which pockets of the new build market are currently achieving the largest house price premiums when compared to the existing market.
Warwick analysed the latest new build property prices and how they compare to the existing market across each area of Britain, with the research showing that nationally, new builds are selling for 29% more than existing homes.
The North East is home to the greatest new build price premium at 53%, with Scotland (44%) and the East Midlands (40%) also performing well.
At just 3%, London is home to the lowest new build price premium when compared to the wider market.
However, this premium can climb far higher when analysing the market at local authority level. In Harlow, the average new build house price is currently £565,501, a huge 106% more than the average of £275,077 seen across the existing market.
Blaenau Gwent is also home to an impressive new build price premium, coming in 99% higher than the wider market, with Gravesham (93%) and Preston (90%) also home to a 90%+ price premium.
Torfaen (89%). West Dunbartonshire (87%), Rochford (87%), Middlesbrough (83%), Merthyr Tydfil (80%) and Nuneaton and Bedworth (80%) also rank within the top 10 highest new build house price premiums.
COO of Warwick Estates, Emma Power, commented:
“Despite the uncertainty posed by the pandemic the UK housing market has boomed and this is no different where the new build market is concerned.
New build homes have continued to command a price premium in every region of Britain and this is not only good news for those developers delivering them to market, but also to new build homebuyers who continue to see their investment hold its value.
In the best performing areas, new build property prices are as much as double that of the existing market which is proof of the value being added by the sector to the wider DNA of the national property market.”
|
Table shows the new build and existing average house price across each nation/region of Britain and the difference |
||||
|
Location |
Average New Build House Price |
Average Existing House Price |
New Build Premium (£) |
New Build Premium (%) |
|
North East |
£206,963 |
£135,584 |
£71,379 |
53% |
|
Scotland |
£229,159 |
£158,862 |
£70,297 |
44% |
|
East Midlands |
£292,664 |
£209,770 |
£82,895 |
40% |
|
West Midlands Region |
£294,479 |
£213,450 |
£81,029 |
38% |
|
North West |
£250,579 |
£182,270 |
£68,309 |
37% |
|
Wales |
£239,299 |
£176,594 |
£62,705 |
36% |
|
Yorkshire and The Humber |
£232,671 |
£179,642 |
£53,028 |
30% |
|
East of England |
£389,416 |
£306,335 |
£83,081 |
27% |
|
South West |
£331,819 |
£276,985 |
£54,834 |
20% |
|
South East |
£401,362 |
£340,295 |
£61,067 |
18% |
|
London |
£508,782 |
£493,617 |
£15,165 |
3% |
|
England |
£333,823 |
£265,592 |
£68,232 |
26% |
|
Great Britain |
£323,667 |
£250,271 |
£73,397 |
29% |
|
|
|
|
|
|
|
Table shows the top 10 areas with the highest new build price premium (%) when compared to the existing market |
||||
|
Location |
Average New Build House Price |
Average Existing House Price |
New Build Premium (£) |
New Build Premium (%) |
|
Harlow |
£565,501 |
£275,077 |
£290,424 |
106% |
|
Blaenau Gwent |
£201,289 |
£101,201 |
£100,088 |
99% |
|
Gravesham |
£559,089 |
£289,889 |
£269,200 |
93% |
|
Preston |
£263,481 |
£138,488 |
£124,993 |
90% |
|
Torfaen |
£306,459 |
£162,455 |
£144,004 |
89% |
|
West Dunbartonshire |
£216,075 |
£115,735 |
£100,340 |
87% |
|
Rochford |
£653,529 |
£350,215 |
£303,314 |
87% |
|
Middlesbrough |
£213,206 |
£116,361 |
£96,845 |
83% |
|
Merthyr Tydfil |
£210,193 |
£116,704 |
£93,489 |
80% |
|
Nuneaton and Bedworth |
£334,539 |
£186,272 |
£148,268 |
80% |


