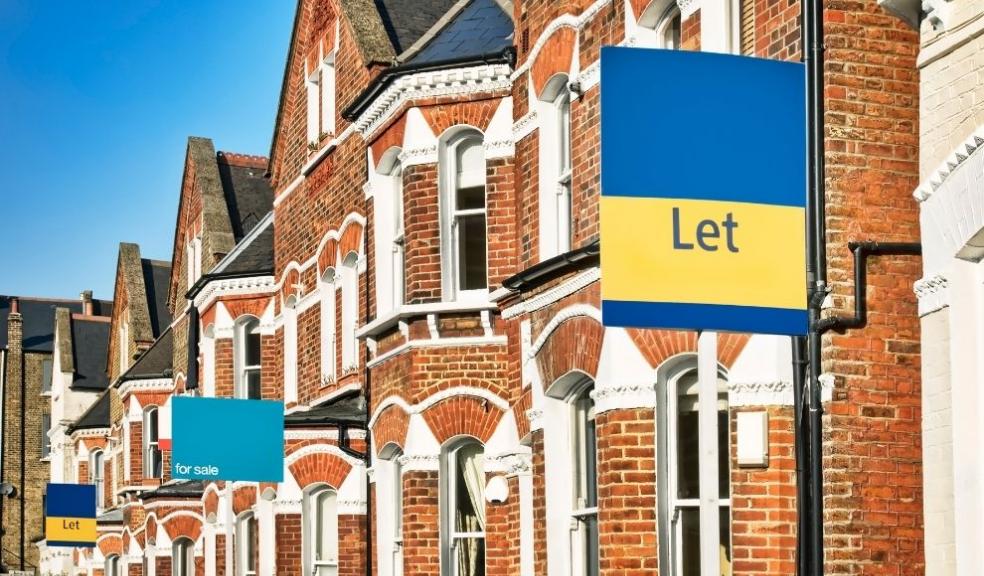
500,000 more of us are now renting - These are the areas with the biggest increases
The latest research by nationwide buy-to-let specialist, Sequre Property Investment, has revealed where across the nation has seen the biggest swing towards renting when compared to homeownership in recent years.
Sequre analysed data on dwellings across each area of England since 2012 and found that currently, 19.5% of the 24.4m dwellings across England sit within the private rental sector. While this has only increased 1% since 2012, this equates to an increase of nearly 500,000 more people living within privately rented properties across the country.
At a regional level, London is home to the highest level of private renters, accounting for 28.8% of total dwellings. The capital has also seen the largest lifestyle swing towards renting with a 2.2% increase since 2012.
However, this increase isn’t confined to the capital and the West Midlands has seen the second-largest increase, with the number of those reliant on rental properties increasing by 1.9% since 2012.
The North East has also seen one of the largest increases at 1.5%, as has the South West (1.3%).
At local authority level, both Greenwich and the City of London have seen the largest uplift in private renters, with both areas seeing the percentage of dwellings sitting within the private rental sector increase by 3.4% since 2012.
In fact, London accounts for eight of the top 10 increases with Newham (2.5%), Tower Hamlets (2.2%), Southwark (2%), Hackney (1.9%), Barking and Dagenham (1.5%) and Lewisham (1.5%) also making the top 10.
Outside of the capital, Telford and Wrekin has seen the number of private rental properties increase by 1.6% since 2012, with Salford also home to one of the largest increases at 1.5%.
Sales Director at Sequre Property Investment, Daniel Jackson, commented:
“The ever-escalating cost of homeownership, coupled with a change in lifestyle choices amongst younger generations, has seen the number of us opting to reside within the private rental sector continue to grow in recent years.
In fact, it’s fair to the role of the private rental sector within the wider landscape of the UK property market has never been as important.
Despite this, the government has consistently looked to deter landlords from the sector in order to boost housing stock in order to address the current housing crisis.
However, it’s clear that with so many remaining reliant on the rental sector in order to live, this lazy approach will only shift the problem from one area of the market to another.”
|
Location |
2012 |
2019 |
Private rental change (%) |
||||
|
Private Rent |
Total Dwellings |
As % of Total Dwellings |
Private Rent |
Total Dwellings |
As % of Total Dwellings |
||
|
London |
898,000 |
3,383,000 |
26.5% |
1,034,000 |
3,593,000 |
28.8% |
2.2% |
|
West Midlands region |
365,000 |
2,387,000 |
15.3% |
433,000 |
2,513,000 |
17.2% |
1.9% |
|
North East |
176,000 |
1,183,000 |
14.9% |
202,000 |
1,237,000 |
16.3% |
1.5% |
|
South West |
432,000 |
2,419,000 |
17.9% |
494,000 |
2,579,000 |
19.2% |
1.3% |
|
East Midlands |
353,000 |
1,983,000 |
17.8% |
393,000 |
2,103,000 |
18.7% |
0.9% |
|
East of England |
435,000 |
2,550,000 |
17.1% |
481,000 |
2,705,000 |
17.8% |
0.7% |
|
North West |
528,000 |
3,155,000 |
16.7% |
570,000 |
3,300,000 |
17.3% |
0.5% |
|
Yorkshire and the Humber |
447,000 |
2,332,000 |
19.2% |
479,000 |
2,441,000 |
19.6% |
0.5% |
|
South East |
651,000 |
3,719,000 |
17.5% |
676,000 |
3,944,000 |
17.1% |
-0.4% |
|
England |
4,286,000 |
23,111,000 |
18.5% |
4,762,000 |
24,414,000 |
19.5% |
1.0% |
|
|
|
|
|
|
|
|
|
|
Location |
2012 |
2019 |
Private rental change (%) |
||||
|
Private Rent |
Total Dwellings |
As % of Total Dwellings |
Private Rent |
Total Dwellings |
As % of Total Dwellings |
||
|
Greenwich |
19,485 |
104,509 |
18.6% |
25,191 |
114,398 |
22.0% |
3.4% |
|
City of London |
2,088 |
5,531 |
37.8% |
2,675 |
6,506 |
41.1% |
3.4% |
|
Newham |
34,898 |
104,121 |
33.5% |
42,124 |
116,979 |
36.0% |
2.5% |
|
Tower Hamlets |
34,933 |
108,254 |
32.3% |
41,885 |
121,539 |
34.5% |
2.2% |
|
Southwark |
29,457 |
124,319 |
23.7% |
35,039 |
136,178 |
25.7% |
2.0% |
|
Hackney |
29,656 |
103,565 |
28.6% |
34,100 |
111,559 |
30.6% |
1.9% |
|
Telford and Wrekin |
10,767 |
69,434 |
15.5% |
13,142 |
76,763 |
17.1% |
1.6% |
|
Barking and Dagenham |
13,507 |
71,431 |
18.9% |
15,511 |
75,829 |
20.5% |
1.5% |
|
Lewisham |
29,067 |
118,839 |
24.5% |
33,277 |
128,115 |
26.0% |
1.5% |
|
Salford |
22,517 |
108,755 |
20.7% |
26,463 |
119,389 |
22.2% |
1.5% |


