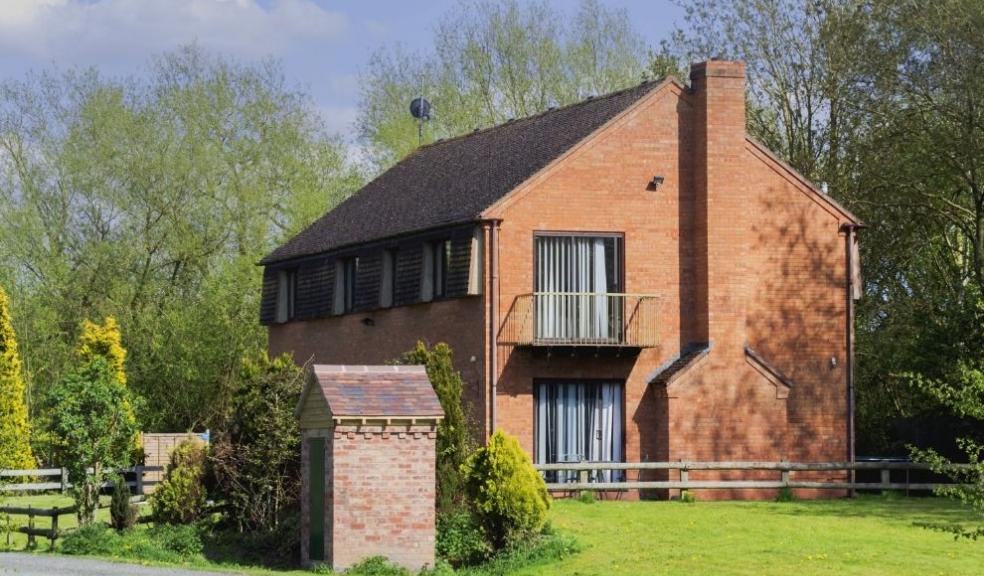
Detached homes have dominated property price growth since 2006, not just since lockdown
The latest research by Warwick Estates has found that detached homes have been outperforming all other property types for at least 15 years, showing that, while recent growth has indeed been strong due to lockdown, detached properties have always been central to the success of the UK housing market.
The past year has seen property prices rise at remarkable speed and none so much as detached homes. It has been reported that the value of detached homes is outperforming all other property types as buyers seek out bigger homes with gardens as a result of being locked down for the best part of a year.
However, the research by Warwick Estates shows that, while recent growth has indeed been strong, detached properties have historically outperformed all other types of home for the past 15 years.
Since 2006, the value of detached homes in England has increased by 63%, equivalent to a rise of £158,165. This is more than semi-detached (60%), terraced (62%), and flats (57%), although all have proved a solid investment.
With bigger rises still, the value of detached homes in Scotland has increased by 65%, or £112,410, while semi-detached (59%), terraced (58%), and flats (36%) lag behind. It’s worth noting that Scotland’s percentage rise is bigger than England’s, but due to the vast difference in property prices in each region, England’s pounds-and-pence growth is the greater of the two (£158,165).
In both Wales and Northern Ireland, the trend remains the same, with the value of detached homes rising by 39% and 18% respectively, more than all other property types.
Regionally, London has seen the most extraordinary price growth with a rise of 119% over 15 years, followed by the South East (81%), East (77%), South West (60%), and the East Midlands (55%) completing the top 5.
One interesting point to note, and the only anomaly in the data, the value of detached homes in the South West has risen by 60%, but so too has the value of semi-detached homes. This makes the South West the only region in the UK where the rising value of detached homes has been matched by another property type.
Finally, it’s hard to ignore the difference between price growth in London, number one on the list, and the North East which sits at the very bottom. With just 19% growth in the value of detached homes, the North East trails 100% behind London, further demonstrating the historic regional disparity that exists in the UK.
COO of Warwick Estates, Emma Power, commented:
“Detached properties appear to be flavour of the month right now with buyers keen to find bigger homes in the wake of COVID-19 lockdowns. But this data shows us that the important role detached homes now have in driving our market forward is not a new phenomenon: they have long been the backbone of residential property.
”The vast gulf between growth in London and growth in the North East is, of course, concerning as it highlights, once again, something we’ve known for a long time about the very different fortunes of our northern and southern markets.
But, we can feel quite optimistic that things will soon have more balance as, in recent months, the North East has shown some very strong growth while London’s market has sputtered. It won’t remain that way for long, of course, but as we move forward, I’m hopeful the gap will be somewhat narrower.”
|
Table shows the best performing property type based on house price increase in the last 15 years |
||||||||
|
Location |
Detached Price Change (£) |
Detached Price Change (%) |
Semi Detached Price Change (£) |
Semi Detached Price Change (%) |
Terraced Price Change (£) |
Terraced Price Change (%) |
Flat Price Change (£) |
Flat Price Change (%) |
|
Scotland |
£112,410 |
65% |
£62,960 |
59% |
£49,805 |
58% |
£29,914 |
36% |
|
England |
£158,165 |
63% |
£94,937 |
60% |
£84,137 |
62% |
£85,888 |
57% |
|
Wales |
£76,748 |
39% |
£47,342 |
38% |
£38,292 |
37% |
£16,863 |
16% |
|
Northern Ireland |
£33,058 |
18% |
£19,080 |
15% |
£8,649 |
9% |
£747 |
1% |
|
By Region |
||||||||
|
London |
£532,161 |
119% |
£332,134 |
115% |
£293,223 |
123% |
£209,081 |
97% |
|
South East |
£267,909 |
81% |
£160,624 |
77% |
£124,196 |
75% |
£70,064 |
49% |
|
East of England |
£201,956 |
77% |
£134,020 |
75% |
£109,692 |
74% |
£66,130 |
50% |
|
South West |
£163,023 |
60% |
£106,604 |
60% |
£85,601 |
58% |
£47,856 |
37% |
|
East Midlands |
£109,528 |
55% |
£69,496 |
54% |
£56,347 |
53% |
£29,753 |
30% |
|
West Midlands region |
£118,046 |
50% |
£68,835 |
49% |
£54,265 |
47% |
£24,949 |
23% |
|
Yorkshire and the Humber |
£91,671 |
45% |
£53,218 |
42% |
£41,005 |
40% |
£19,705 |
18% |
|
North West |
£97,559 |
45% |
£60,447 |
44% |
£40,387 |
40% |
£26,089 |
24% |
|
North East |
£37,780 |
19% |
£21,043 |
18% |
£13,865 |
14% |
-£908 |
-1% |


