


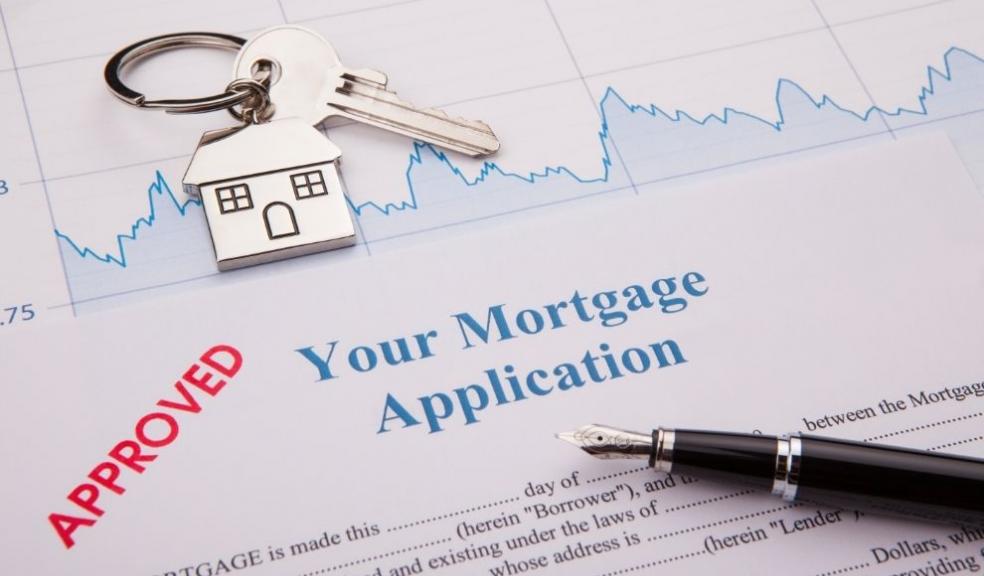
Mortgages fuel 70% of transactions since industry lockdown ended
Research by the leading mortgage broker for global high-net-worths, Enness Global Mortgages, has shown that mortgages have fuelled 70% of property transactions across Great Britain since the market reopened back in May of last year, after initial lockdown restrictions were imposed.
Enness analysed market data on the number of mortgage financed sales as a percentage of all sales in each area of Britain between May 2020 and November 2020 (latest available data).
While 270,785 of the 387,667 homes sold across Britain (70%) have seen the buyer backed by a mortgage, there is some regional difference. In London, 80% of all sales have come via homebuyers with a mortgage, with the East of England, West Midlands (72%), South East and East Midlands (71%) also coming in higher than the national benchmark.
In contrast, the South West is home to the most cash homebuyers with just 64% of homebuyers purchasing via a mortgage.
With the capital home to the largest regional percentage of mortgage backed purchases, it’s no surprise that London also accounts for the top three highest at local authority level. Lewisham is the mortgage hotspot of Britain for homebuyers with 88% of all transactions financed via the sector, with Barking and Dagenham and Waltham Forest ranking next (87%).
Slough and Crawley are home to the highest percentage of mortgage based purchases outside of London along with Hillingdon (86%). Sutton, Thurrock (85%), Green and Merton (84%) complete the top 10.
At the other end of the spectrum, just 40% of transactions in East Lindsey have been financed by a mortgage since the market reopened in May of last year. North Norfolk (43%), Argyll and Bute (44%), Torridge, Ceredigion (45%), Scarborough (48%), Rother, South Hams and Pembrokeshire also rank with some of the lowest levels of mortgage financed transactions.
CEO of Enness Global Mortgages, Islay Robinson, commented:
“A lot has been made about the boost in buyer demand due to the stamp duty holiday, but it’s the continued low rates of borrowing that have really been the foundation of this heightened market activity.
While a stamp duty saving is nice, the ability to secure finance at a much lower rate of interest than historically possible has brought about a major boost to market sentiment in recent years and the impact is clear, with 70% of all transactions financed as such.
Some lenders have begun to tighten their lending criteria and this could make it harder for those with a less stable financial background to obtain a mortgage. However, it’s unlikely to impact the actual ratio of mortgage financed buyers in relation to those purchasing with cash, particularly while the Bank of England keeps rates at sub-one per cent.”
|
Table shows the number of transactions financed via cash and mortgage buyers since the market reopened in May 2020 and the percentage swing |
|||||
|
Location |
Cash Sales |
Mortgage Sales |
Total Sales |
Cash as a % of Total |
Mortgaged as a % of Total |
|
Great Britain |
116,882 |
270,785 |
387,667 |
30% |
70% |
|
England |
94,013 |
223,649 |
317,662 |
30% |
70% |
|
London |
6,396 |
25,710 |
32,106 |
20% |
80% |
|
East of England |
10,616 |
27,137 |
37,753 |
28% |
72% |
|
West Midlands Region |
8,732 |
22,110 |
30,842 |
28% |
72% |
|
South East |
16,286 |
40,092 |
56,378 |
29% |
71% |
|
East Midlands |
8,638 |
21,056 |
29,694 |
29% |
71% |
|
Yorkshire and The Humber |
10,375 |
23,263 |
33,638 |
31% |
69% |
|
North West |
13,644 |
30,072 |
43,716 |
31% |
69% |
|
Scotland |
17,452 |
36,817 |
54,269 |
32% |
68% |
|
Wales |
5,407 |
10,283 |
15,690 |
34% |
66% |
|
North East |
5,687 |
10,359 |
16,046 |
35% |
65% |
|
South West |
13,639 |
23,850 |
37,489 |
36% |
64% |
|
|
|
|
|
|
|
|
Table shows the areas with the highest number of transactions financed via mortgaged homebuyers |
|||||
|
Location |
Cash Sales |
Mortgage Sales |
Total Sales |
Cash as a % of Total |
Mortgaged as a % of Total |
|
Lewisham |
158 |
1,139 |
1,297 |
12% |
88% |
|
Barking and Dagenham |
76 |
523 |
599 |
13% |
87% |
|
Waltham Forest |
139 |
901 |
1,040 |
14% |
87% |
|
Slough |
60 |
382 |
442 |
14% |
86% |
|
Crawley |
62 |
379 |
441 |
14% |
86% |
|
Hillingdon |
161 |
966 |
1,127 |
14% |
86% |
|
Sutton |
152 |
834 |
986 |
15% |
85% |
|
Thurrock |
133 |
726 |
859 |
15% |
85% |
|
Greenwich |
150 |
809 |
959 |
16% |
84% |
|
Merton |
145 |
773 |
918 |
16% |
84% |
|
|
|
|
|
|
|
|
Table shows the areas with the highest number of transactions financed via mortgaged homebuyers excluding London |
|||||
|
Location |
Cash Sales |
Mortgage Sales |
Total Sales |
Cash as a % of Total |
Mortgaged as a % of Total |
|
Slough |
60 |
382 |
442 |
14% |
86% |
|
Crawley |
62 |
379 |
441 |
14.% |
86% |
|
Thurrock |
133 |
726 |
859 |
15% |
85% |
|
Harlow |
66 |
345 |
411 |
16% |
84% |
|
Rushmoor |
83 |
428 |
511 |
16% |
84% |
|
Wokingham |
171 |
878 |
1,049 |
16% |
84% |
|
Luton |
132 |
660 |
792 |
17% |
83% |
|
Basildon |
167 |
823 |
990 |
17% |
83% |
|
Watford |
79 |
383 |
462 |
17% |
83% |
|
Midlothian |
172 |
826 |
998 |
17% |
83% |
|
|
|
|
|
|
|
|
Table shows the areas with the lowest number of transactions financed via mortgaged homebuyers |
|||||
|
Location |
Cash Sales |
Mortgage Sales |
Total Sales |
Cash as a % of Total |
Mortgaged as a % of Total |
|
East Lindsey |
596 |
399 |
995 |
60% |
40% |
|
North Norfolk |
465 |
350 |
815 |
57% |
43% |
|
Argyll and Bute |
562 |
438 |
1,000 |
56% |
44% |
|
Orkney Islands |
105 |
82 |
187 |
56% |
44% |
|
Torridge |
275 |
224 |
499 |
55% |
45% |
|
Ceredigion |
221 |
181 |
402 |
55% |
45% |
|
Scarborough |
487 |
456 |
943 |
52% |
48% |
|
Rother |
419 |
411 |
830 |
50% |
50% |
|
South Hams |
407 |
403 |
810 |
50% |
50% |
|
Pembrokeshire |
333 |
331 |
664 |
50% |
50% |


